Wanna know when silver will go on its next surge?
We can actually make an intelligent estimate, based on data and trends from history.
I haven’t seen anyone else document this, but I think it’s valuable intel for us silver investors…
|
Remember This Chart? |
It documents all the spikes in the silver price since the 1970s. Not bull markets per se, just spikes. It shows the percentage gain and how long each lasted. |
|
Since 1970, there have been 12 major spikes in the silver price. Interestingly, they occurred during both bull markets (seven) and bear markets (five).
From this data we further learn that…
|
• The average gain of all spikes is 150.4% (if you use median it’s 89.7%) • The average duration of spikes is just 7.4 months. |
In other words, silver’s spikes are both big and short-lived. There’s another implication here as well: you have to be prepared for the next spike before it sets in. Given its sudden volatility, to wait until it starts is too late. I know many of you have been doing that. And yes, the wait has been frustrating… it’s been a year now since the last one. Which means there’s another thing I wanted to know, which you may be interested in knowing, too… |
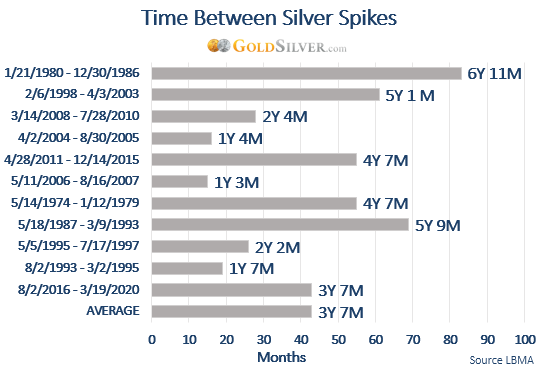
How Long Between Spikes? |
I thought it might be valuable to calculate the time between the spikes, to see what we can learn.
I measured the time between all the spikes above, from the end of each to the beginning of the next. Here’s what it shows.
|
|
You can see there is wide variety in the time between spikes, ranging from one year and three months to a whopping 5 years and nine months. Again though, this includes both bull and bear markets. And it’s noteworthy that the two longest times—1987 to 1993 and 1998 to 2003—took place during clear bear markets. If we remove those two (assuming you believe we’re currently in a bull market), the average drops by an entire year, to 2 years and seven months. Silver’s last spike peaked on September 1 last year… we don’t know if it will take another year or more for the next one to kick in—or if like some of the shorter time periods is ready to burst out soon—but based on this 50-year history we do know the current lag is not abnormal. It fits within silver’s pattern. |
• Silver’s DNA is one of lackluster price movement, sometimes for years at a time, punctuated by sudden and violent spikes. Regardless of whether it’s a bull or bear market. |
I understand if some of you have some doubts that there will be another big spike in the silver price. It may “feel” like that’s the case, but here’s the thing: you’d be arguing against history. And, by default, putting your faith in the current monetary system.
Those are dangerous assumptions in my opinion. Mike has to be only half right about this episode of Hidden Secrets of Money for the next spike to kick in and match or exceed that big one from the late ‘70s.
Even without Mike’s exhaustive research, we know the silver price spikes every three years or so.
Hang in there, my friends. We can’t control when the next price explosion will ignite, but we can control how well prepared we are for its inevitability.
If you’re interested, I bought some more of these on Tuesday.
|


